Introduction
In part 1 of this series, we used the OpenShift Ansible Installer to install Openshift Origin on three servers that were running Fedora 25 Atomic Host. The three machines we’ll be using have the following roles and IP address configurations:
|    Role     |  Public IPv4   | Private IPv4 |
|-------------|----------------|--------------|
| master,etcd | 54.175.0.44    | 10.0.173.101 |
| worker      | 52.91.115.81   | 10.0.156.20  |
| worker      | 54.204.208.138 | 10.0.251.101 |
In this blog, we’ll explore the installed Origin cluster and then launch an application to see if everything works.
The Installed Origin Cluster
With the cluster up and running, we can log in as admin to the master
node via the oc command. To install the oc CLI on your machine, you can
follow these
instructions
or, on Fedora, you can install via dnf install origin-clients. For
this demo, we have the origin-clients-1.3.1-1.fc25.x86_64 rpm
installed:
$ oc login --insecure-skip-tls-verify -u admin -p OriginAdmin https://54.175.0.44:8443
Login successful.

You have access to the following projects and can switch between them with 'oc project <projectname>':

  * default
    kube-system
    logging
    management-infra
    openshift
    openshift-infra

Using project "default".
Welcome! See 'oc help' to get started.
NOTE: --insecure-skip-tls-verify was added because we do not have
properly signed certificates. See the
docs
for installing a custom signed certificate.
After we log in we can see that we are using the default namespace.
Let’s see what nodes exist:
$ oc get nodes
NAME           STATUS                     AGE
10.0.156.20    Ready                      9h
10.0.173.101   Ready,SchedulingDisabled   9h
10.0.251.101   Ready                      9h
The nodes represent each of the servers that are a part
of the Origin cluster. The name of each node corresponds with its
private IPv4 address. Also note that the 10.0.173.101 is the private
IP address from the master,etcd node and that its status contains
SchedulingDisabled. This is because we specified
openshift_schedulable=false for this node when we did the install in
part
1.
Now let’s check the pods, services, and routes that are running in the default namespace:
$ oc get pods -o wide
NAME                       READY     STATUS    RESTARTS   AGE       IP             NODE
docker-registry-3-hgwfr    1/1       Running   0          9h        10.129.0.3     10.0.156.20
registry-console-1-q48xn   1/1       Running   0          9h        10.129.0.2     10.0.156.20
router-1-nwjyj             1/1       Running   0          9h        10.0.156.20    10.0.156.20
router-1-o6n4a             1/1       Running   0          9h        10.0.251.101   10.0.251.101
$
$ oc get svc
NAME               CLUSTER-IP       EXTERNAL-IP   PORT(S)                   AGE
docker-registry    172.30.2.89      <none>        5000/TCP                  9h
kubernetes         172.30.0.1       <none>        443/TCP,53/UDP,53/TCP     9h
registry-console   172.30.147.190   <none>        9000/TCP                  9h
router             172.30.217.187   <none>        80/TCP,443/TCP,1936/TCP   9h
$
$ oc get routes
NAME               HOST/PORT                                        PATH      SERVICES           PORT               TERMINATION
docker-registry    docker-registry-default.54.204.208.138.xip.io              docker-registry    5000-tcp           passthrough
registry-console   registry-console-default.54.204.208.138.xip.io             registry-console   registry-console   passthrough
NOTE: If there are any pods that have failed to run, you can try to
debug with the oc status -v, and oc describe pod/<podname> commands.
You can retry any failed deployments with the oc deploy <deploymentname> --retry
command.
We can see that we have a pod, service, and route for both a
docker-registry and a registry-console. The docker registry is where
any container builds within OpenShift will be pushed and the registry
console is a web frontend interface for the registry.
Notice that there are two router pods and they are running on two
different nodes; the worker nodes. We can effectively send traffic to
either of these nodes and it will get routed appropriately. For our
install we elected to set the openshift_master_default_subdomain to
54.204.208.138.xip.io. With that setting we are only directing traffic
to one of the worker nodes. Alternatively, we could have configured this
as a hostname that was load balanced and/or performed round robin to
either worker node.
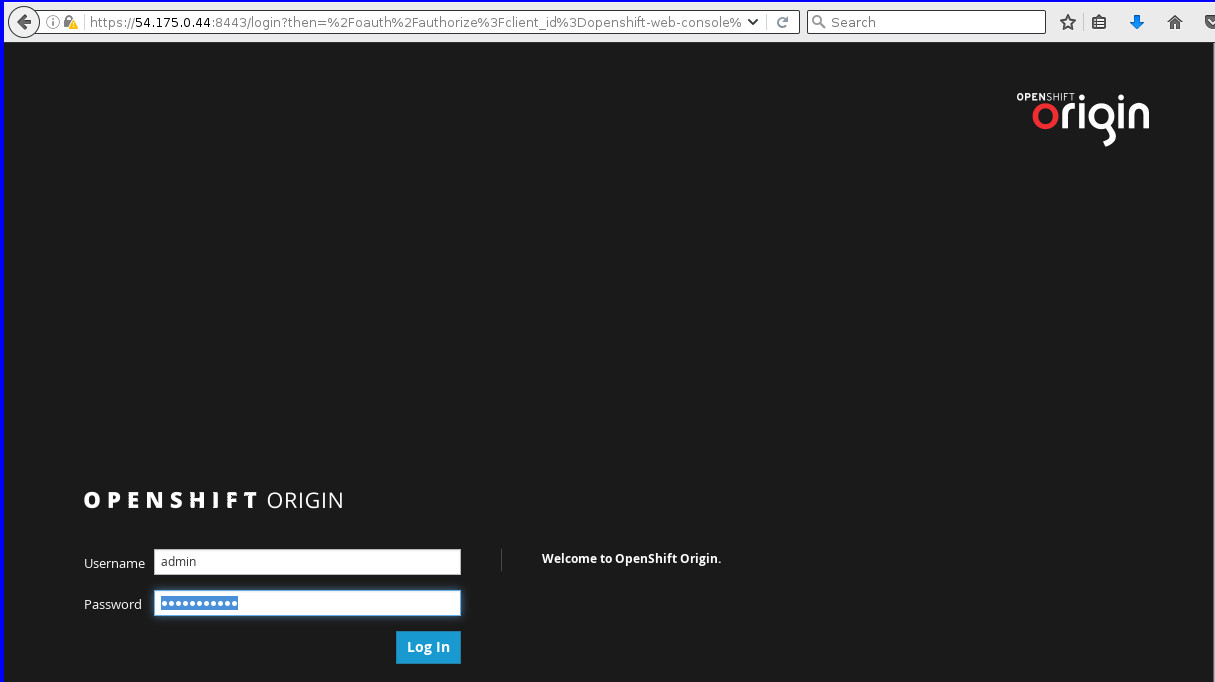
Now that we have explored the install, let’s try out logging in as
admin to the openshift web console at https://54.175.0.44:8443:
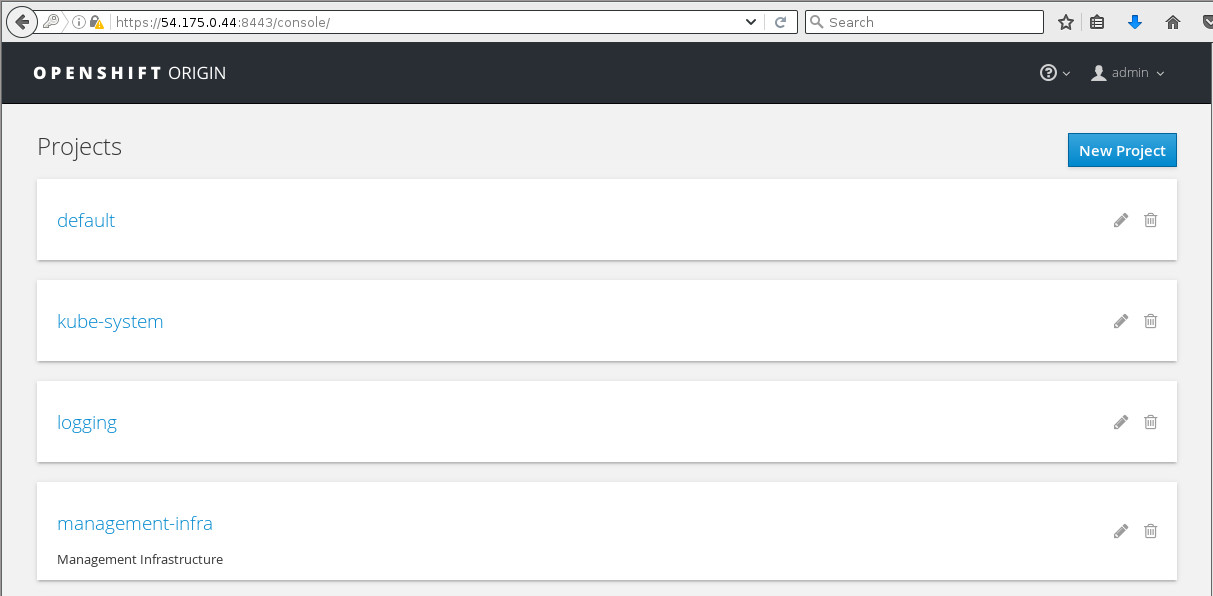
And after we’ve logged in, we see the list of projects that the
admin user has access to:
We then select the default project and can view the same applications
that we looked at before using the oc command:
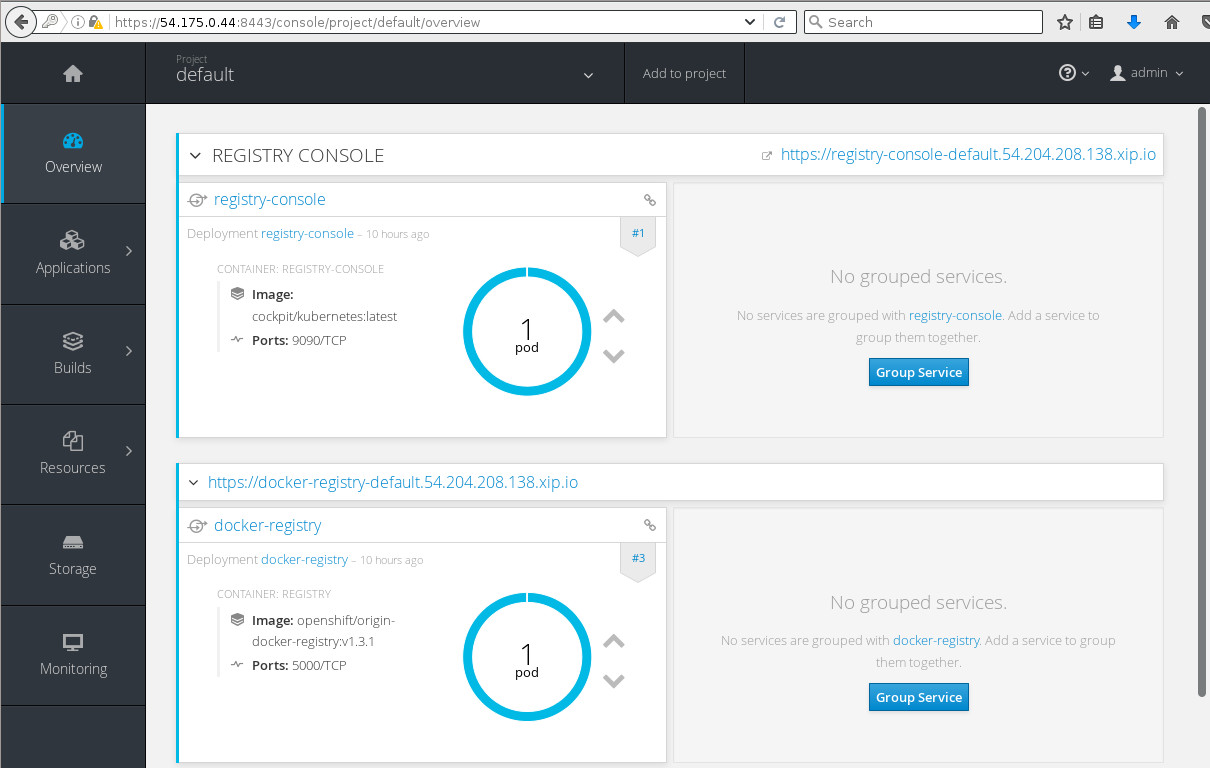
At the top, there is the registry console. Let’s try out accessing the
registry console by clicking the
https://registry-console-default.54.204.208.138.xip.io/ link in the
top right. Note that this is the link from the exposed route:
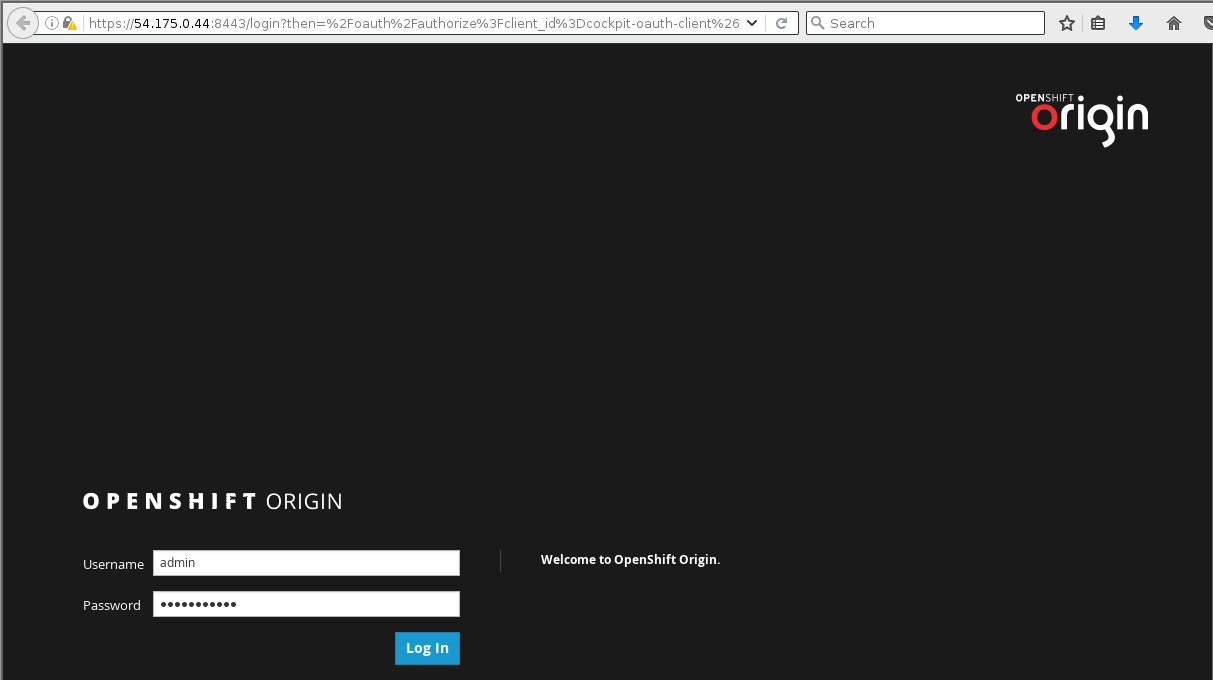
We can log in with the same admin/OriginAdmin credentials that we used
to log in to the OpenShift web console.
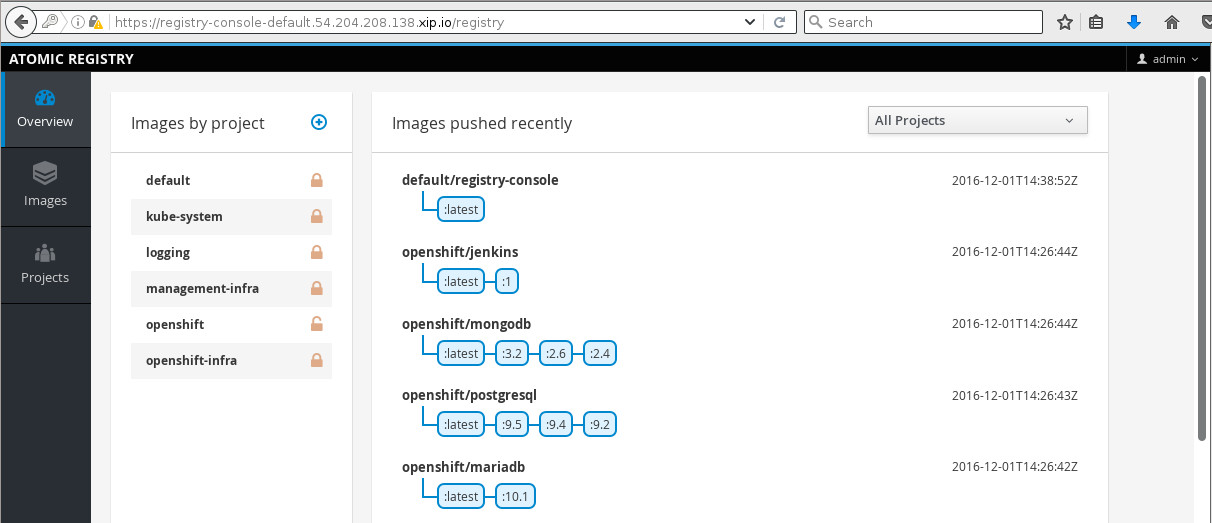
After logging in, there are links to each project so we can see images that belong to each project, and we see recently pushed images.
And.. We’re done! We have poked around the infrastructure of the
installed Origin cluster a bit. We’ve seen registry pods, router pods,
and accessed the registry web console frontend. Next we’ll get fancy and
throw an example application onto the platform for the user user.
Running an Application as a Normal User
Now that we’ve observed some of the more admin like items using the
admin user’s account, we’ll give the normal user a spin. First,
we’ll log in:
$ oc login --insecure-skip-tls-verify -u user -p OriginUser https://54.175.0.44:8443
Login successful.

You don't have any projects. You can try to create a new project, by running

    oc new-project <projectname>
After we log in as a normal user, the CLI tools recognize pretty quickly
that this user has no projects and no applications running. The CLI
tools give us some helpful clues as to what we should do next: create a
new project. Let’s create a new project called myproject:
$ oc new-project myproject
Now using project "myproject" on server "https://54.175.0.44:8443".

You can add applications to this project with the 'new-app' command. For example, try:

    oc new-app centos/ruby-22-centos7~https://github.com/openshift/ruby-ex.git

to build a new example application in Ruby.
After creating the new project the CLI tools again give us some helpful
text showing us how to get started with a new application on the
platform. It is telling us to try out the ruby application with source
code at
github.com/openshift/ruby-ex.git
and build it on top of the
Source-to-Image
(or
S2I)
image known as centos/ruby-22-centos7. Might as well give it a spin:
$ oc new-app centos/ruby-22-centos7~https://github.com/openshift/ruby-ex.git
--> Found Docker image ecd5025 (10 hours old) from Docker Hub for "centos/ruby-22-centos7"

    Ruby 2.2
    --------
    Platform for building and running Ruby 2.2 applications

    Tags: builder, ruby, ruby22

    * An image stream will be created as "ruby-22-centos7:latest" that will track the source image
    * A source build using source code from https://github.com/openshift/ruby-ex.git will be created
      * The resulting image will be pushed to image stream "ruby-ex:latest"
      * Every time "ruby-22-centos7:latest" changes a new build will be triggered
    * This image will be deployed in deployment config "ruby-ex"
    * Port 8080/tcp will be load balanced by service "ruby-ex"
      * Other containers can access this service through the hostname "ruby-ex"

--> Creating resources with label app=ruby-ex ...
    imagestream "ruby-22-centos7" created
    imagestream "ruby-ex" created
    buildconfig "ruby-ex" created
    deploymentconfig "ruby-ex" created
    service "ruby-ex" created
--> Success
    Build scheduled, use 'oc logs -f bc/ruby-ex' to track its progress.
    Run 'oc status' to view your app.
Let’s take a moment to digest that. A new image
stream
was created to track the upstream ruby-22-centos7:latest image. A
ruby-ex
buildconfig
was created that will perform an
S2I
build that will bake the source code into the image from the
ruby-22-centos7 image stream. The resulting image will be the source
for another image stream known as ruby-ex. A
deploymentconfig
was created to deploy the application into pods once the build is done.
Finally, a ruby-ex service was created so the application can be load
balanced and discoverable.
After a short time, we check the status of the application:
$ oc status
In project myproject on server https://54.175.0.44:8443

svc/ruby-ex - 172.30.213.94:8080
  dc/ruby-ex deploys istag/ruby-ex:latest <-
    bc/ruby-ex source builds https://github.com/openshift/ruby-ex.git on istag/ruby-22-centos7:latest
      build #1 running for 26 seconds
    deployment #1 waiting on image or update

1 warning identified, use 'oc status -v' to see details.
NOTE: The warning referred to in the output is a warning about
there being no healthcheck defined for this service. You can view the
text of this warning by running oc status -v.
We can see here that there is a svc (service) that is associated with a
dc (deploymentconfig) that is associated with a bc (buildconfig) that
has a build that has been running for 26 seconds. The deployment is
waiting for the build to finish before attempting to run.
After some more time:
$ oc status
In project myproject on server https://54.175.0.44:8443

svc/ruby-ex - 172.30.213.94:8080
  dc/ruby-ex deploys istag/ruby-ex:latest <-
    bc/ruby-ex source builds https://github.com/openshift/ruby-ex.git on istag/ruby-22-centos7:latest
    deployment #1 running for 6 seconds

1 warning identified, use 'oc status -v' to see details.
The build is now done and the deployment is running.
And after more time:
$ oc status
In project myproject on server https://54.175.0.44:8443

svc/ruby-ex - 172.30.213.94:8080
  dc/ruby-ex deploys istag/ruby-ex:latest <-
    bc/ruby-ex source builds https://github.com/openshift/ruby-ex.git on istag/ruby-22-centos7:latest
    deployment #1 deployed about a minute ago - 1 pod

1 warning identified, use 'oc status -v' to see details.
We have an app! What are the running pods in this project?:
$ oc get pods
NAME              READY     STATUS      RESTARTS   AGE
ruby-ex-1-build   0/1       Completed   0          13m
ruby-ex-1-mo3lb   1/1       Running     0          11m
The build has Completed and the ruby-ex-1-mo3lb pod is Running.
The only thing we have left to do is expose the service so that it can
be accessed via the router from the outside world:
$ oc expose svc/ruby-ex
route "ruby-ex" exposed
$ oc get route/ruby-ex
NAME      HOST/PORT                                 PATH      SERVICES   PORT       TERMINATION
ruby-ex   ruby-ex-myproject.54.204.208.138.xip.io             ruby-ex    8080-tcp
With the route exposed we should now be able to access the application
on ruby-ex-myproject.54.204.208.138.xip.io. Before we do that we’ll
log in to the openshift console as the user user and view the running
pods in project myproject:
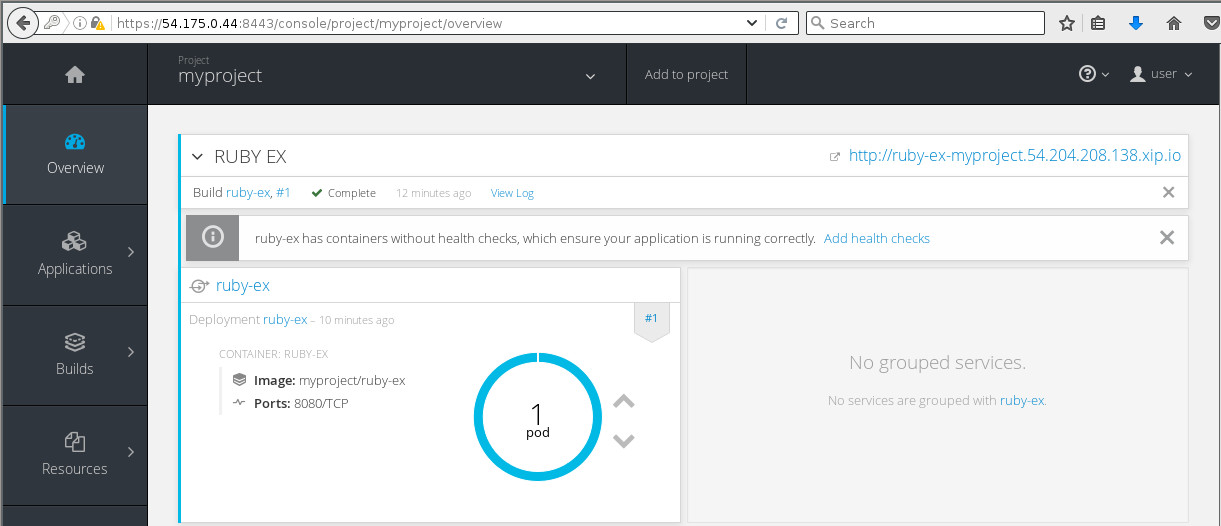
And pointing the browser to ruby-ex-myproject.54.204.208.138.xip.io we
see:
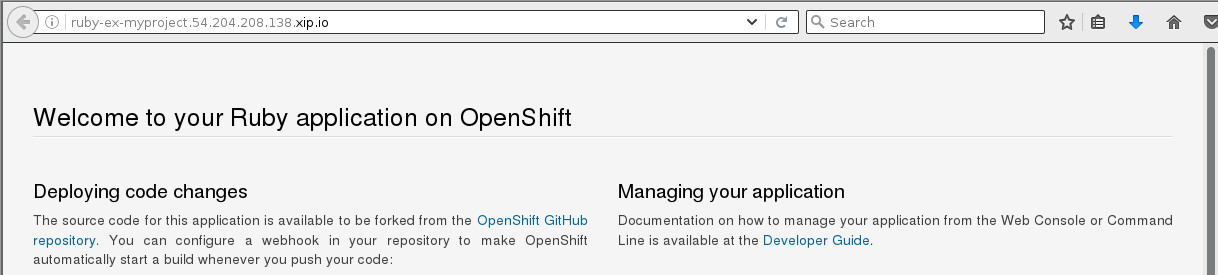
Woot!
Conclusion
We have explored the basic OpenShift Origin cluster that we set up in part 1 of this two part blog series. We viewed the infrastructure docker registry and router components, as well as discussed the router components and how they are set up. We also ran through an example application that was suggested to us by the command line tools and were able to define that application, monitor its progress, and eventually access it from our web browser. Hopefully this blog gives the reader an idea or two about how they can get started with setting up and using an Origin cluster on Fedora 25 Atomic Host.
Enjoy!
Dusty